Infographics
We
offer a wide range of infographics on issues relating to Renewable Energies. The
infographics are free of charge for our monetary supporters and journalists and may be used according to
our terms of use. Initially, the infographics appear in the media library in a
72 dpi version. Users who are logged in can download a high resolution version.
For access to the high resolution infographics please apply here.
Customized graphics service
Do you need a customized infographic for your company? We create graphics on order.
Please contact us: b.bischof@unendlich-viel-energie.de and briefly describe your request. We will be happy to make you an offer.
-
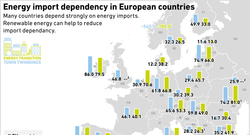
Energy import dependency in the EU and selected countries
Many countries depend strongly on energy imports. Renewable energy can help to reduce import dependancy.
-
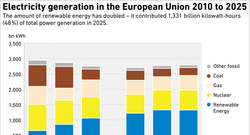
Electricity generation in the EU (graphic dossier)
The amount of electricity from renewable energy sources has doubled since 2010, providing 48 % of total power generation in 2025
-
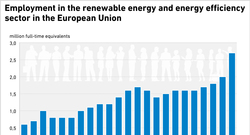
Employment in the renewable energy and energy efficiency sector in the EU
In 2022 almost 2,7 million people in the European Union worked in the renewable energy and energy efficiency sector.
-
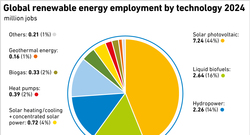
Global renewable energy employment (graphic dossier)
In 2024 renewable energy employed more than 16.6 million people around the globe. Since 2012, employment has grown from 7.3 million. Some figures only refer to direct employment, e.g. hydropower.
-
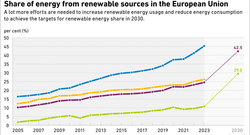
Share of energy from renewable sources in the EU
The share of energy from renewable sources in gross final energy consumption, gross electricity consumption, heating and cooling and transport has grown significantly in the European Union since 2005.
-
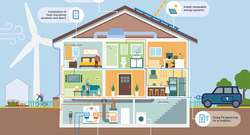
The energy efficient house – sustainable and future proof (graphic dossier)
Well insulated roofs and facades, as well as modern windows and doors, significantly reduce heating and cooling requirements.
Social Media